
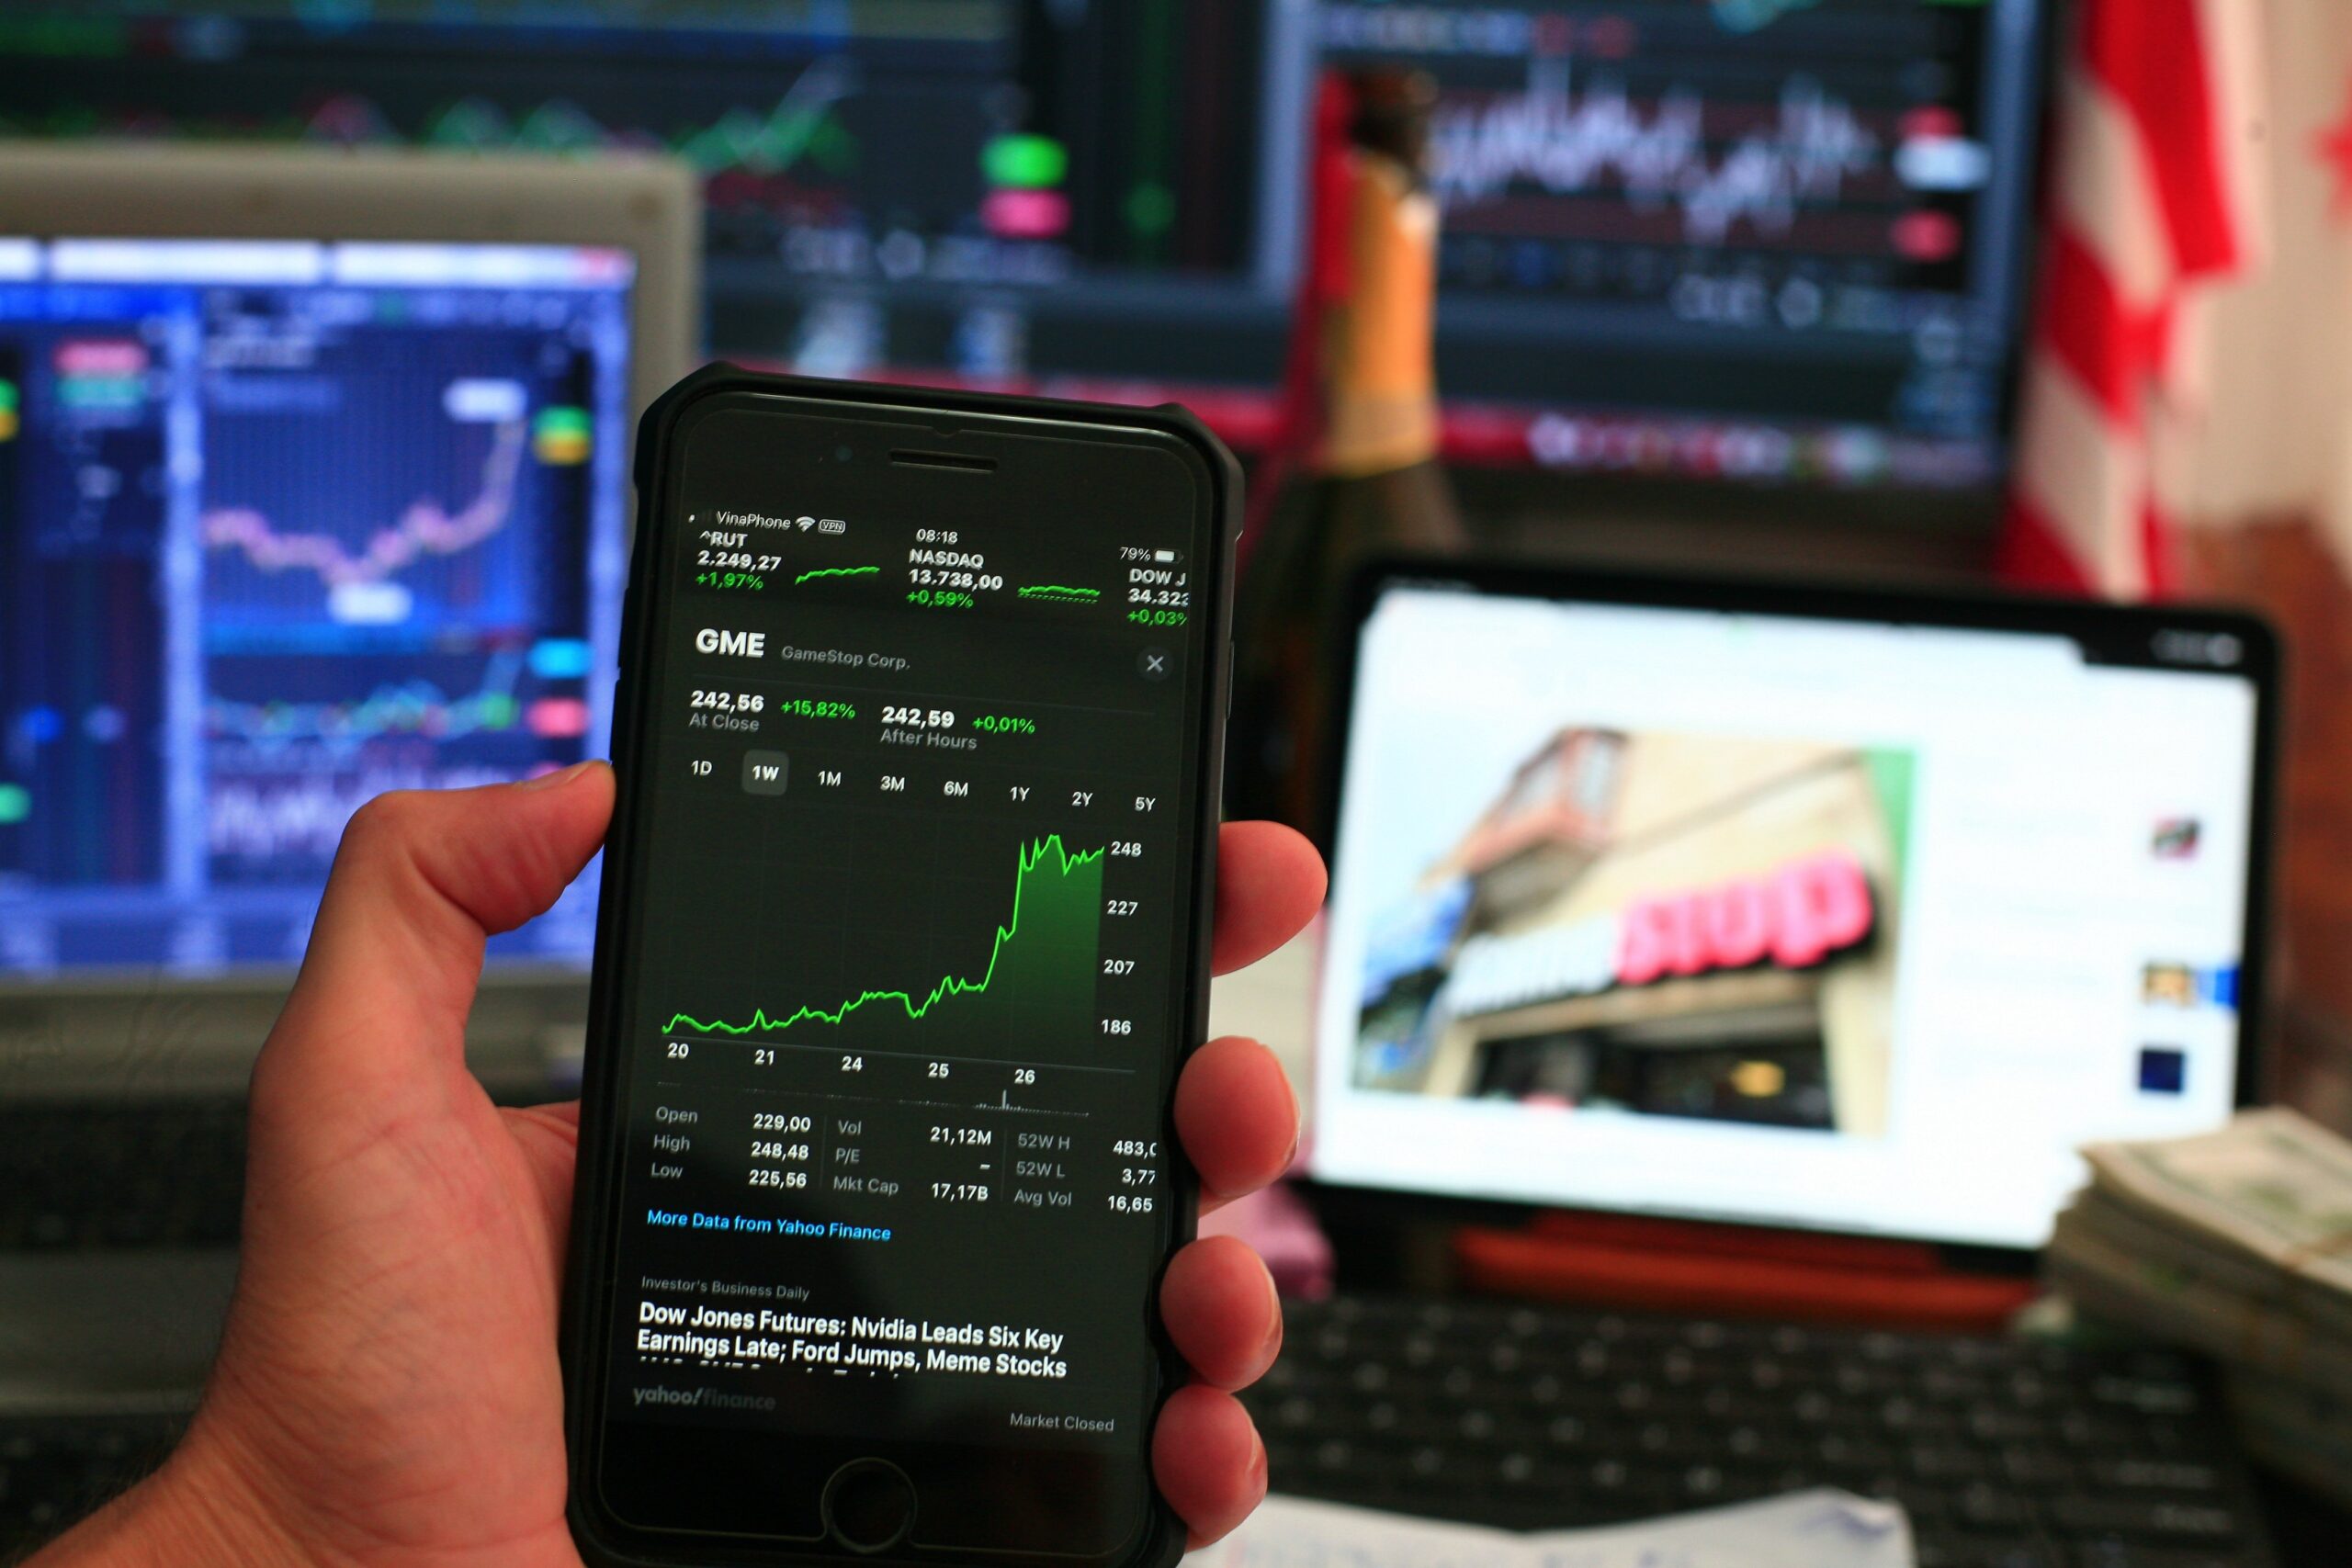
Volume – How to Interpret Buying and Selling Pressure in a Stock
Volume is one of the most useful, yet often underestimated, tools in technical analysis. By using volume, you can get a better understanding of the strength behind a price movement. For example, a stock may rise sharply. But there is a big difference between an upward move that occurs with very high trading volume and an upward move that occurs with very low volume. High volume shows that many market participants are participating in the move, while low volume may indicate that the move has weaker support.
Volume can therefore be used to:
- confirm an upward or downward trend
- assess the strength of a buy or sell signal
- detect when a trend is beginning to weaken
- identify possible trend reversals
- find short-term trading opportunities
- assess whether a breakout is supported by the market.
The most important principle is simple: Price shows what the stock is doing. Volume shows how much force is behind the move.
How do you use volume in technical analysis?
Volume analysis should normally not be used in isolation. A good approach is to first analyze the stock’s overall trend and then use volume to confirm or question that analysis. Therefore, start by examining:
- Is the stock in an upward, downward, or sideways trend?
- Are there clear support and resistance levels?
- Is there any technical pattern?
- What does the stock’s momentum look like?
- Does volume confirm the picture shown by the price?
If both the price movement and volume are pointing in the same direction, the signal is normally more interesting. If, on the other hand, the price shows strength while volume is developing negatively, you should be more cautious.
A simple rule of thumb
Rising price + rising volume = strength
Falling price + rising volume = weakness
However, it is important not to oversimplify this. Volume must always be interpreted in relation to where the stock is in its trend.
Positive and negative volume balance
One useful way to analyze volume is to compare volume on up days with volume on down days.
Positive volume balance
We refer to positive volume balance when the stock tends to rise on high volume and fall on lower volume. This is generally a positive sign. It shows that there is strong buying interest when the stock price rises, while sellers are not as aggressive when the price falls. Positive volume balance can therefore:
- strengthen a buy signal
- weaken a sell signal
- confirm an upward trend
- show that buying interest is strong
- indicate that a decline is coming to an end.
If you are considering buying a stock, positive volume development is therefore something you would ideally want to see together with a positive trend.
Negative volume balance
Negative volume balance means the opposite: the stock falls on high volume and rises on lower volume. This is a warning sign. It may mean that many investors want to sell when the price falls, while buying interest is weaker when the price rises. Negative volume balance can therefore:
- strengthen a sell signal
- weaken a buy signal
- confirm a downward trend
- show that selling pressure is increasing
- indicate that an upward move is beginning to lose momentum.
If you already own the stock and the technical trend is still positive but the volume balance has become negative, you should therefore pay extra attention.
Volume and trend
Volume becomes particularly interesting when it is analyzed together with the trend. In an upward trend, you ideally want to see:
- high volume when the price rises
- lower volume when the price falls
- high activity near new highs
- less activity near temporary lows.
This shows that buyers are active when the price rises and that sellers are not strong enough to drive the price downward. In a downward trend, you will often see the opposite:
- high volume when the price falls
- lower volume during shorter upward moves
- strong selling interest near lows
- weak buying interest during upward moves.
When this pattern changes, it can be an early warning signal.
When volume deviates from the trend
One of the most interesting things about volume is that it sometimes begins to change before the price does.
Suppose a stock is in an upward trend. For several weeks, up days have had high volume while down days have had low volume. Suddenly, volume begins to decrease when the stock rises. At the same time, volume increases during down days. This does not automatically mean that the stock will fall, but it shows that the balance between buyers and sellers is beginning to change. It may be an early warning signal that the upward trend is beginning to weaken.
Positive correlation between price and volume
When price and volume develop in the same direction, it can be a sign of strength. In an upward trend, it is positive when trading volume increases at the same time as the stock price rises. This shows that the upward move is supported by increasing market participation. A typical positive scenario is:
Price rises → volume increases → price corrects → volume decreases → price rises again on high volume.
This shows that buyers are still in control. Positive price and volume development can therefore:
- strengthen a buy signal
- weaken a sell signal
- confirm an upward trend
- show increasing buying interest
- indicate continued upward movement.
Even in a downward trend, a shift toward positive volume development can be interesting. If the price stops falling and then begins to rise on increasing volume, it may be an initial sign that sellers are beginning to lose control.
Negative correlation between price and volume
Negative price and volume development is normally a sign of weakness. For example, this could involve a stock that rises on low volume but falls sharply on high volume. This shows that sellers are more aggressive than buyers. Negative volume development can therefore:
- strengthen a sell signal
- weaken a buy signal
- confirm a downward trend
- show that buying interest is weak
- indicate that an upward move is beginning to lose momentum.
If a stock is in an upward trend but begins to fall on increasingly higher volume, you should therefore be alert. This could be the beginning of a larger correction or a trend reversal.
Volume and breakouts
Volume is particularly useful when a stock breaks through a support or resistance level. Suppose a stock has been trading between SEK 100 and SEK 110 for several weeks. The SEK 110 level acts as resistance. If the stock suddenly breaks above SEK 110, it is a possible buy signal. But the question is:
How strong is the breakout?
If the breakout occurs with sharply increasing volume, it is more convincing. Many investors are participating in the move, and the breakout therefore has clearer support. If, on the other hand, the stock breaks above SEK 110 on very low volume, you should be cautious. Such a breakout may be false, and the price may quickly fall back below resistance.
Basic rule
A breakout on high volume is normally more reliable than a breakout on low volume.
When very high volume can be a warning signal
High volume is not always positive. It is very important to analyze what the price is doing at the same time that volume increases. A sharp rise on extremely high volume can, for example, be a sign of very strong buying interest. But if the stock has already risen for a long time, a sudden explosive rise on very high volume can sometimes be what is known as a climactic rally. This means that many investors rush into the stock after a long upward move. Optimism is then extreme. If the sharp rise is subsequently followed by a rapid and substantial decline, it may be a sign that the long-term upward move is coming to an end. However, it is important not to draw this conclusion too early.
A stock can continue rising significantly longer than many investors expect. High volume and a strong price increase are therefore not in themselves a sell signal. It is only when the price begins to show weakness that the situation becomes more interesting.
Sell-off – heavy selling
The opposite phenomenon can occur after a long and sharp decline. A stock may fall very sharply on extremely high volume. This can be what is known as a sell-off, where many investors sell at the same time. Such a situation can occur after a long period of negative news and pessimism. When almost everyone who wants to sell has already sold, selling pressure may eventually begin to decrease. If the stock then begins to rise on increasing volume, it may be a sign that market sentiment is beginning to change. But here too, caution is required. A sharp decline does not automatically mean that the stock has reached a bottom. A downward trend can continue significantly longer than expected. A better buying opportunity only occurs when you see clearer signs that:
- selling pressure is decreasing
- the price is stabilizing
- volume is developing positively
- buyers are beginning to take control
- the short-term trend is turning upward.
Candlesticks and volume
Candlestick charts are a very useful tool for short-term analysis. Each candlestick normally shows:
- opening price
- highest price
- lowest price
- closing price.
Together with volume, you get a much better picture of what is actually happening during the trading day. The important thing is not only whether the stock is rising or falling. You also want to know:
How many investors are participating in the move?
The basic principle of volume bars
A simple way to begin analyzing volume is to compare volume on up days with volume on down days.
Positive situation
High volume on an up day + low volume on a down day. This shows that many people want to buy when the price rises, while relatively few want to sell when the price falls. This is normally positive.
Negative situation
High volume on a down day + low volume on an up day. This shows that selling pressure is high while buying interest is weaker. This is normally negative. It is therefore often more interesting to study the relationship between up-volume and down-volume than to simply look at absolute volume.
Short-term volume analysis
In short-term trading, volume can provide valuable information about changes in market psychology. Imagine the following development:
The stock rises for several days in a row and volume increases. This shows that more and more investors are participating in the upward move. The stock then falls for two days, but volume is low. This is not necessarily negative. It may be a normal pullback where few investors are willing to sell. If the stock then begins to rise again and volume increases sharply, it may be a sign of strength.
The opposite is more concerning:
The stock rises but volume decreases. Then the stock begins to fall and volume increases. The balance has now changed, and sellers are beginning to gain greater influence.
Candlestick patterns
Candlestick patterns are often used to identify short-term buy and sell signals. They can provide information about changes in optimism and pessimism among market participants. However, candlestick patterns should not be regarded as certain forecasts. They are short-term in nature and can therefore be strongly affected by market noise. It is therefore wise to combine candlestick analysis with:
- trend analysis
- support and resistance
- volume
- momentum
- other technical indicators.
The more independent factors that confirm the same signal, the more interesting it becomes.
Hammer – Hammer
A hammer is a candlestick pattern that often occurs after a decline. It is characterized by:
- a small body
- a long lower wick
- a small or no upper wick.
The long lower wick shows that sellers managed to push the price down during the day, but that buyers then took over and pushed the price back up. This shows that the market has begun to defend the lower price level.
The psychology behind the hammer
The price initially falls sharply. During the day, buyers enter the market and push the price higher. When the stock closes near the day’s high, it shows that buyers have regained some control. This can be an initial sign that the decline is beginning to weaken.
Volume is important
A hammer becomes more interesting if it occurs with higher volume than during the preceding down days. One possible confirmation is for the price to subsequently close above the hammer’s body or high. A stop-loss can be placed below the level where the hammer’s low was recorded, depending on the strategy and risk level being used.
Shooting Star – Shooting Star
A shooting star is essentially the opposite of a hammer. It usually occurs after a longer upward move. The pattern has:
- a small body
- a long upper wick
- a small or no lower wick.
It shows that buyers initially managed to push the price higher, but that sellers then took over and pushed the price back down. After a longer upward move, it can be a warning signal that buying pressure is beginning to weaken. Here too, volume and subsequent price action should be used for confirmation.
Inverted Hammer – Inverted Hammer
An inverted hammer can occur after a decline. It is characterized by:
- a small body
- a long upper wick
- a small or no lower wick.
The pattern shows that buyers attempted to push the price higher during the day, but that sellers still had significant control. Therefore, confirmation is normally required. If the next trading day closes clearly higher, it may show that buyers have actually taken over. Higher volume than during previous down days strengthens the signal.
Bullish Engulfing – Bullish Engulfing
Bullish engulfing is a two-day pattern that can signal a trend reversal after a decline. The first day is normally negative. The next day opens weak but then reverses sharply upward. The second candlestick has a large positive body that covers the previous candlestick’s body. This shows that market psychology has changed rapidly.
The psychology
At first, sellers are in control. Then buyers enter and manage not only to stop the decline but also to push the price sharply higher. This shows that sellers are beginning to lose momentum. The pattern becomes more interesting if:
- volume is high
- the next trading day continues upward
- the stock is near a support level
- the long-term trend is positive.
Bearish Engulfing – Bearish Engulfing
Bearish engulfing is the opposite of bullish engulfing. The pattern normally occurs after an upward move and shows that sellers suddenly take control. The first day is positive and is followed by a strong negative candlestick that covers the previous candlestick’s body. It can be a warning signal that the upward move is beginning to lose momentum.
Bullish Harami – Bullish Harami
A bullish harami consists of two candlesticks and usually occurs after a decline. The first candlestick has a relatively large body. The second has a significantly smaller body that fits within the first. This shows that the previous strong move is beginning to lose momentum. The market is beginning to hesitate. It can be an initial sign of a trend reversal. Confirmation is obtained if the next candlestick closes above the pattern’s high.
Bearish Harami – Bearish Harami
Bearish harami is the opposite of bullish harami. It normally occurs after an upward move. The smaller second candlestick shows that buyers’ momentum has begun to weaken. The pattern can therefore be an early warning signal of a possible trend reversal from an upward to a downward trend.
Morning Star – Morning Star
The morning star is a three-day pattern that can signal a trend reversal after a decline. The pattern consists of:
- a strong negative candlestick
- a small candlestick showing uncertainty
- a strong positive candlestick.
On the first day, the decline continues. On the second day, the move slows and the market begins to hesitate. On the third day, buyers take over and push the price higher. This shows a clear shift in market psychology. The pattern becomes more interesting if it is accompanied by:
- positive volume development
- support from a longer-term upward trend
- an important technical support area.
Evening Star – Evening Star
The evening star is the opposite of the morning star. It normally occurs after a longer upward move and can signal that buyers are beginning to lose control. The pattern consists of three candlesticks, with the final one showing clear selling pressure. It can be a warning signal that the upward trend is beginning to reverse downward.
Piercing Line – Piercing Line
Piercing line is a two-day pattern that can occur after a decline. On the first day, the price continues downward. The next day, the stock opens weak, but buyers gradually take control and push the price higher so that it closes more than halfway up the body of the previous negative candlestick. This shows that sellers are beginning to lose control. The pattern becomes stronger if the following day continues upward and volume increases at the same time.
Dark Cloud Cover – Dark Cloud Cover
Dark cloud cover is the opposite of piercing line. It occurs after an upward trend. The stock opens strongly, but sellers take over during the day and push the price significantly lower. This shows that buyers’ control is beginning to weaken. The pattern can therefore serve as a warning signal of a possible decline.
Gap
A gap occurs when a stock opens at a level that is clearly above or below the previous trading day’s price range.
Gap Up
A gap up occurs when the day’s low is above the previous day’s high. This can show that market expectations have changed significantly, for example following news or another important event. A gap up can be positive, especially if it is followed by continued upward movement and high volume. But here too, confirmation is required. If the stock quickly falls back and closes below the gap’s low, it is a sign of weakness.
Three White Soldiers – Three White Soldiers
Three white soldiers is a pattern consisting of three consecutive positive candlesticks with progressively higher closing prices. The pattern can occur after a longer decline and then signal a possible trend reversal. It can also occur after a consolidation within an already rising trend and function as a continuation pattern. The pattern shows that buyers have taken a clear grip on the market. It becomes particularly interesting if there is also:
- increasing volume
- a positive long-term trend
- clear support behind the price.
Three Black Crows – Three Black Crows
Three black crows is the opposite of three white soldiers. The pattern consists of three negative candlesticks with progressively lower closing prices. After a longer upward move, it can be a signal that the trend is beginning to weaken. It can also occur as a continuation pattern within an already declining trend.
When during the day should you trade?
Volume and candlesticks can also provide information about when during the trading day buying and selling interest is strongest. Some stocks have a clear pattern where buyers are most active in the morning. Other stocks have greater buying interest later in the day. If a stock often opens weak but rises during the trading day, it may show that buying interest increases after the open. If, on the other hand, the stock often opens strongly but falls during the day, it may show that sellers become more active during the trading day. For short-term traders, this can be valuable information. However, this does not mean that you should automatically buy at the open or sell at the close. The pattern must first be identified by studying the stock’s historical price and volume development.
Volume is a confirmation tool
The most important lesson is that volume should rarely be used alone. A volume signal becomes significantly more interesting when it confirms what is already visible in the price chart. For example:
Upward trend + breakout above resistance + high volume, is significantly more convincing than:
Upward trend + breakout above resistance + very low volume.
In the same way:
Downward trend + break below support + high volume, shows significantly greater selling strength than a break below support that occurs on very low volume. Volume therefore functions as a kind of confirmation of the market’s conviction.
Limitations of volume
Volume indicators are primarily useful for short-term and medium-term analysis. They can quickly react to changes in market psychology, but they can also be affected by temporary noise. Therefore, you should avoid making long-term investment decisions based solely on a single volume signal. A sharp increase in volume can, for example, be caused by:
- news
- an earnings report
- a large order
- an index change
- a technical breakout
- temporary speculation.
The important thing is therefore to analyze why volume is changing and how the price reacts to the change.
A simple checklist for volume analysis
When analyzing a stock, you can ask yourself the following questions:
1. What trend is the stock in?
Is the trend upward, downward, or sideways?
2. What does volume look like during upward moves?
Does volume increase when the price rises?
3. What does volume look like during downward moves?
Does selling volume increase when the price falls?
4. Does volume confirm the trend?
In an upward trend, you ideally want to see stronger volume during upward moves than during downward moves.
5. Is there a breakout?
If the price breaks an important support or resistance level – does it occur on high or low volume?
6. Has volume changed?
A sudden change can be more important than the absolute volume level.
7. Is there a candlestick pattern?
If there is a hammer, bullish engulfing, morning star, or another pattern – is it confirmed by volume?
8. Is there support from other indicators?
The more technical factors that point in the same direction, the stronger the overall picture becomes.
Summary
Volume does not tell you where a stock will go. However, it can help you understand how strong the current price movement is. The most important thing is to learn how to read the relationship between price and volume. Remember the basic principles:
- A rising price on high volume is normally positive.
- A falling price on high volume is normally negative.
- A rising price on low volume should be analyzed with greater caution.
- A falling price on low volume can be a normal pullback in a strong trend.
- A breakout on high volume is normally more convincing than a breakout on low volume.
- A change in volume can provide an early warning that a trend is beginning to weaken.
- Candlestick patterns become more useful when confirmed by volume and trend.
- A single volume signal should not form the basis for an investment decision.
The most useful question is therefore not simply: “Is the stock rising or falling?” but rather: “With how much force is the stock rising or falling – and is the move confirmed by volume?”
It is by combining price, trend, volume, support and resistance, as well as candlestick patterns that you get a more complete picture of what is happening behind the price movement.
VOLUME IS AN IMPORTANT INDICATOR FOR IDENTIFYING POWERFUL BUY SIGNALS
Volume is one of the absolute most important foundations for identifying a powerful buy signal in finance and technical analysis. Volume shows where large institutional capital is moving.
As you can see above, volume is an important indicator for identifying powerful buy signals in day and swing trading. The only problem is that doing this yourself can be overwhelming and confusing – not to mention that it can be EXTREMELY time-consuming to analyze a large number of different stocks entirely on your own. But there is a tool that does all of this for you instantly …
It saves you hours every week and gives you robust buy signals immediately. It is the type of tool that even experienced traders have been using for a long time.
The tool is the Bukefalos algorithm. It is an algorithm for advanced technical analysis that we have developed to identify the strongest buy signal of the week on Nasdaq Stockholm. Our goal is to make +4% faster than anyone else per stock trade over time. Almost every Thursday, we deliver a premium buy signal that we trade ourselves (if we do not receive a sufficiently strong buy signal, we choose to wait). We provide a payout/cash-out signal at +4% and a sell signal when our target price is reached.
Our signals are easy to use and eliminate a great deal of the guesswork that takes a long time to analyze. They are simple and practical to use and have been well tested over a long period of time. Feel free to read more in detail about our trading results in recent years and conduct your own due diligence.
Every Thursday, you receive the week’s buy signal easily and conveniently directly in your email. And every time we receive a sell signal, you are notified immediately. Over time, you learn how we identify strong buy signals, and you get valuable inspiration for your own trading and stock investing by studying what the indicators look like for all of our stock purchases. You gradually learn in a natural, visual way and gain more and more trading experience.
So, now you can try our buy and sell signals for an entire month for only SEK 9, and you can cancel whenever you want – there is no commitment of any kind.
Would you like to try it?