

Moving averages (MA) are among the oldest, most reliable, and most widely used indicators in technical stock analysis. For a day trader or swing trader, they serve as a compass in an otherwise chaotic market. A classic trading strategy is to buy when the short-term moving average crosses above the long-term moving average, and to…

Momentum and RSI RSI, or Relative Strength Index, is one of the most widely used indicators in technical analysis. RSI is used to measure the strength of a stock’s price movement and can provide valuable information about short-term momentum. For a trader, this is important because it is not only the direction of the stock…
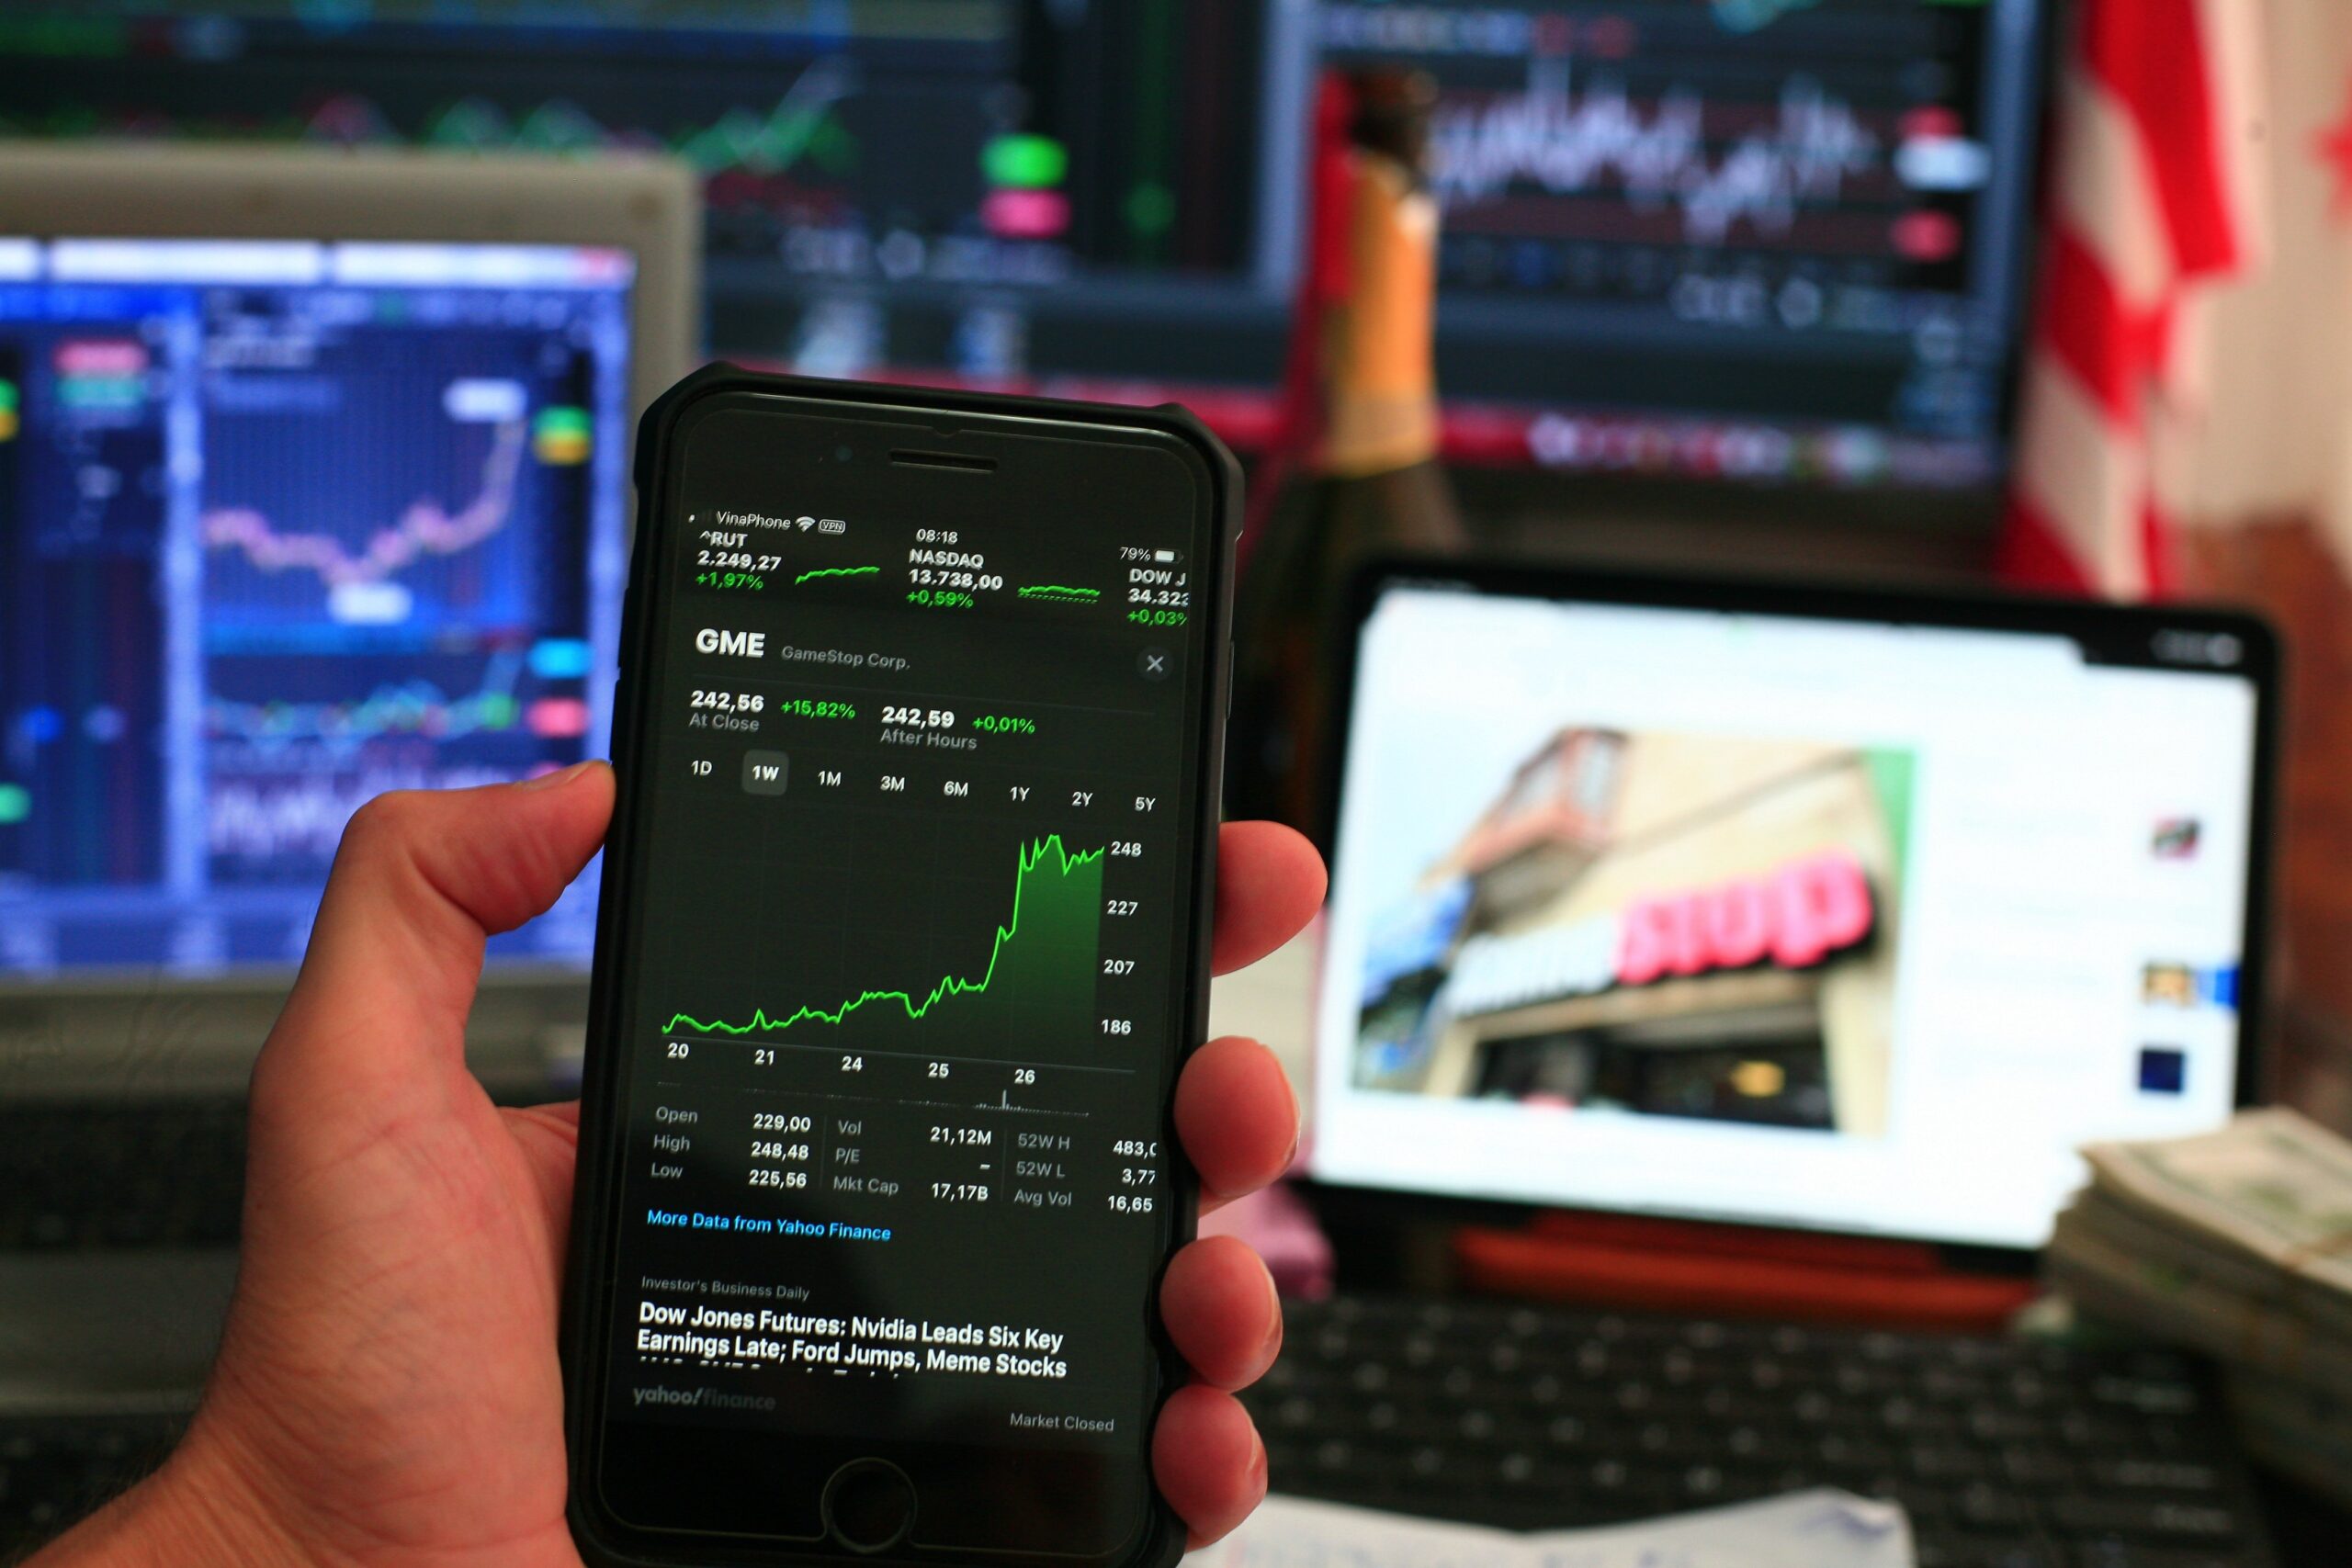
Volume – How to Interpret Buying and Selling Pressure in a Stock Volume is one of the most useful, yet often underestimated, tools in technical analysis. By using volume, you can get a better understanding of the strength behind a price movement. For example, a stock may rise sharply. But there is a big difference…
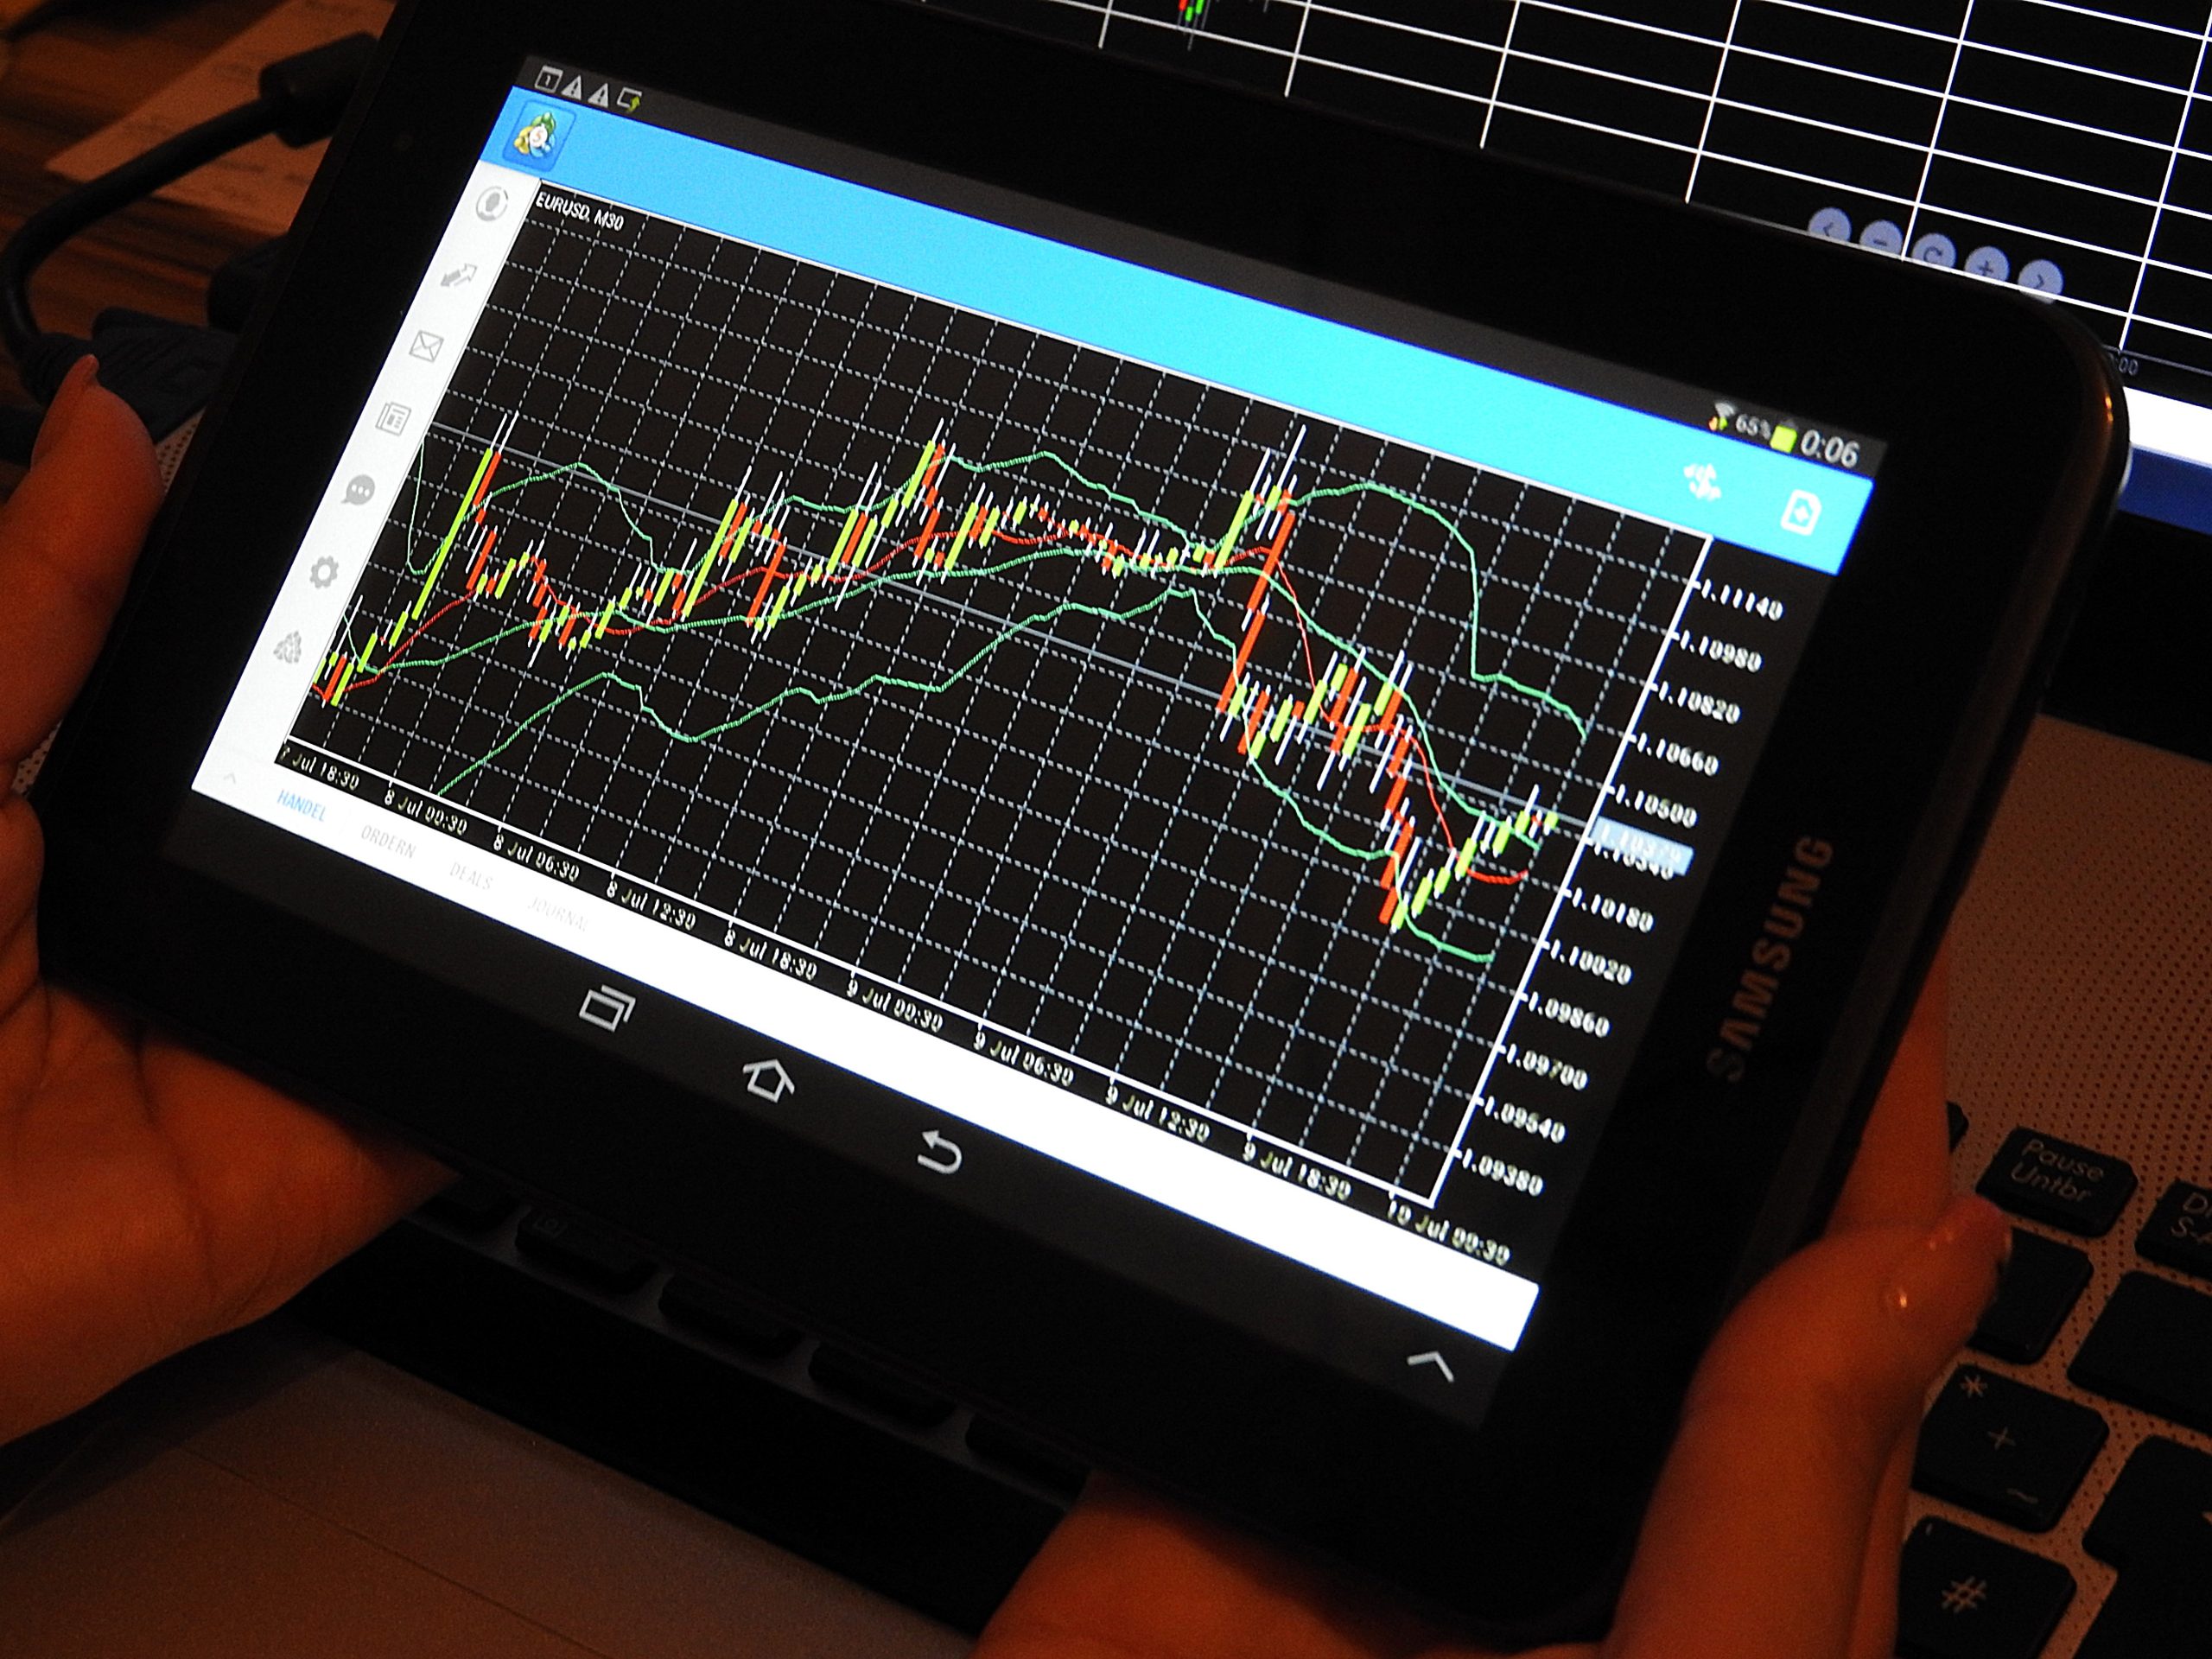
Chart patterns are some of the most fundamental and useful concepts in day trading and technical analysis. A price chart is more than just a series of numbers moving up and down. Every move on the chart is the result of an ongoing battle between buyers and sellers. When buyers are more aggressive than sellers,…

SUPPORT AND RESISTANCE HOW TO USE SUPPORT AND RESISTANCE TO IDENTIFY A POWERFUL BUY SIGNAL: Support and resistance are among the most fundamental and useful concepts in day trading and technical analysis. They are used to identify price levels where the market tends to reverse, pause, or break through. Support is a price level where…

TRENDS HOW TO USE TRENDS TO IDENTIFY A POWERFUL BUY SIGNAL: Trends are one of the most important indicators in technical analysis. A trend describes the overall direction of a stock’s or market’s price movement over a specific period of time. Understanding trends is essential for anyone who wants to succeed as a day trader,…